Ingredients · release 2026.1
DG-0005: Soybean flour
Glycine max (NCBI taxon 3847). Protein 44.2% w/w as supplied (nitrogen factor 5.64, the factor in use when its dispersions were made; soybean now uses 5.50).
The IPI, MPI and MEM results describe protein extracts the Data Garden made from this flour in its lab, one per route, not the flour as supplied. They show what its protein can do once extracted.
Extraction yields
| Extract | Route | Protein recovered, % (isolated / input protein) | Protein recovered, % (isolated / total input material) |
|---|---|---|---|
| DG-0005-IPI | IPI isoelectric precipitation | 66.3 | 29.3 |
| DG-0005-MPI | MPI micellar isolation | 10.6 | 4.70 |
| DG-0005-MEM | MEM membrane concentration | 74.3 ± 4.40 | 32.9 |
Photos of the extracts (9)
DG-0005-IPI isoelectric precipitation
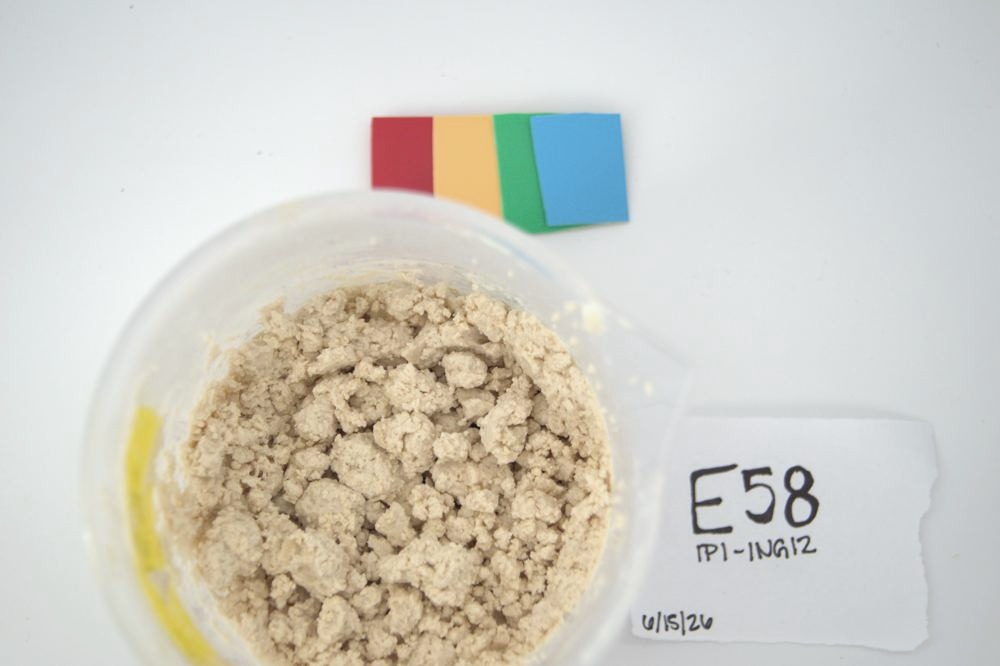
Final Extract · 2026-06-24 · color-corrected, as takenThe finished extract as it was stored and sampled for every assay in this dataset. 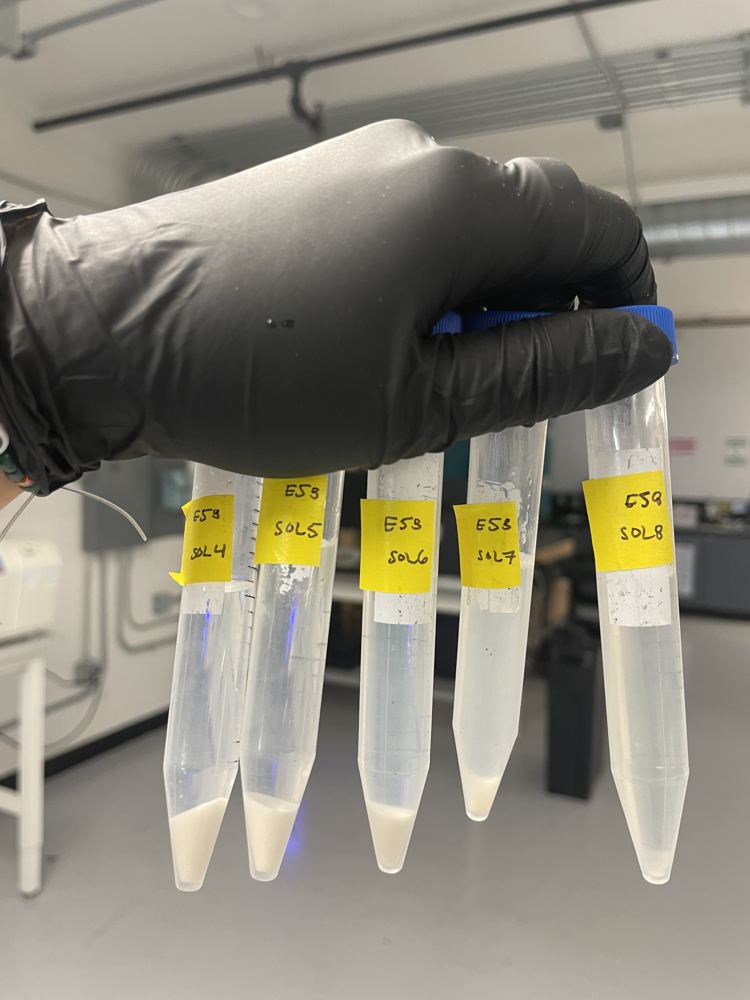
Solubility · 2026-06-17Tubes after the spin, one per pH. Solubility is the protein measured in the supernatant above the pellet (Bradford) against the dispersion before the spin, so a clear supernatant over a solid pellet reads low. 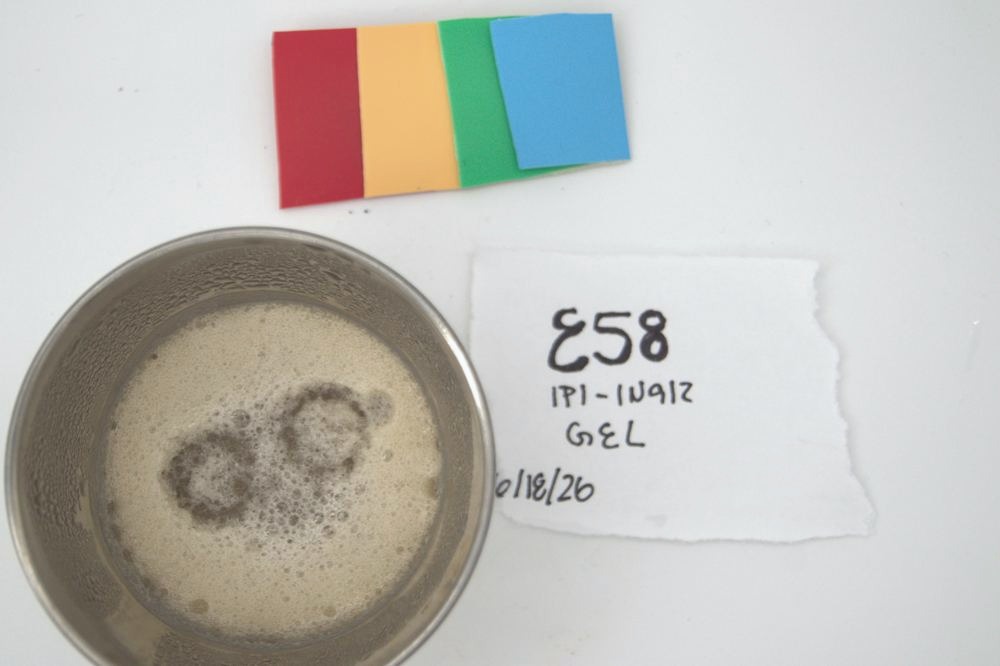
10% Gel (post-TPA) · 2026-06-24 · color-corrected, as takenThe gel after the two-compression texture test. Firmness is the force at the first compression peak.
DG-0005-MPI micellar isolation
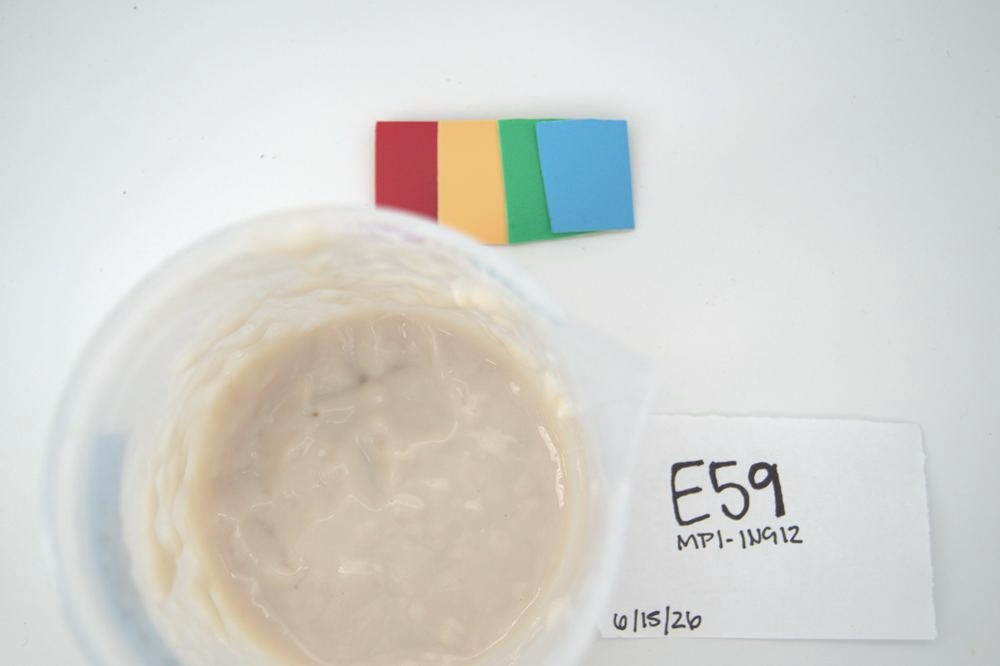
Final Extract · 2026-06-24 · color-corrected, as takenThe finished extract as it was stored and sampled for every assay in this dataset. 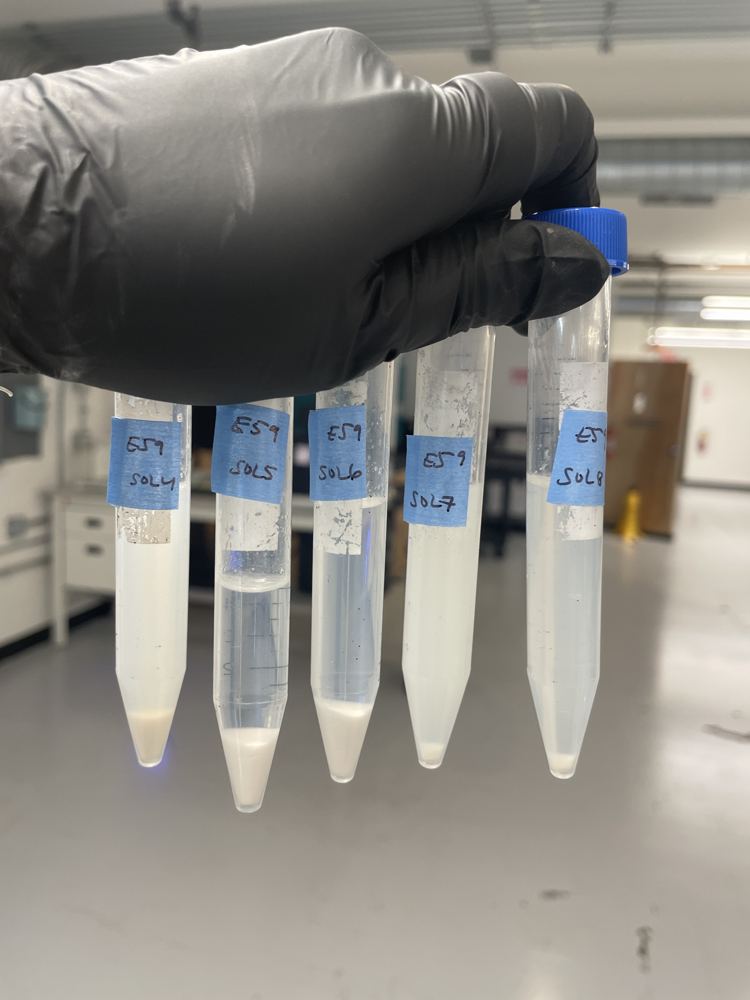
Solubility · 2026-06-17Tubes after the spin, one per pH. Solubility is the protein measured in the supernatant above the pellet (Bradford) against the dispersion before the spin, so a clear supernatant over a solid pellet reads low. 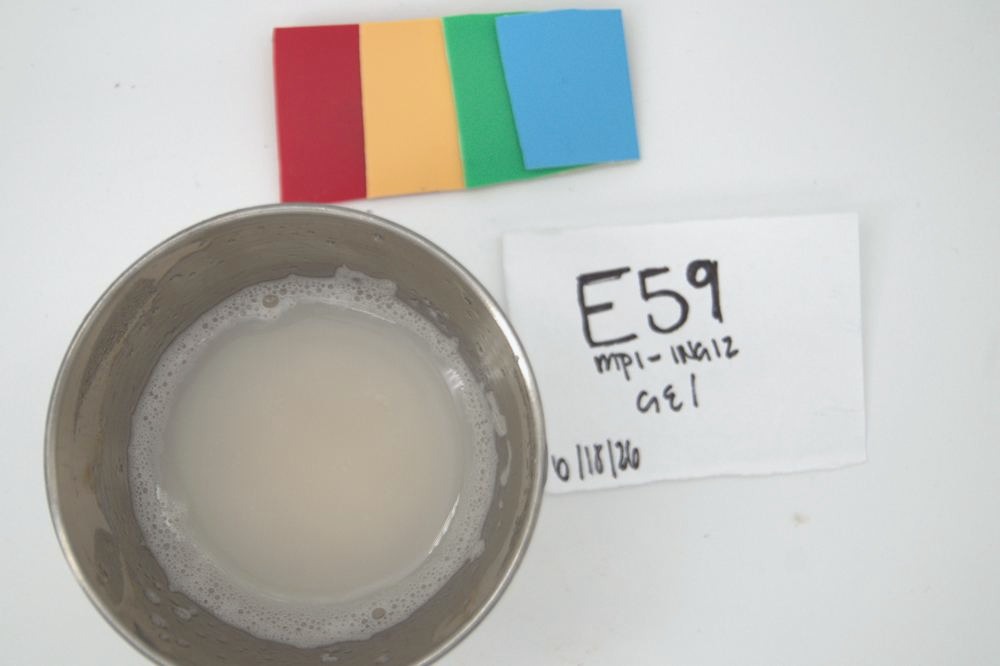
10% Gel (post-TPA) · 2026-06-24 · color-corrected, as takenThe gel after the two-compression texture test. Firmness is the force at the first compression peak.
DG-0005-MEM membrane concentration
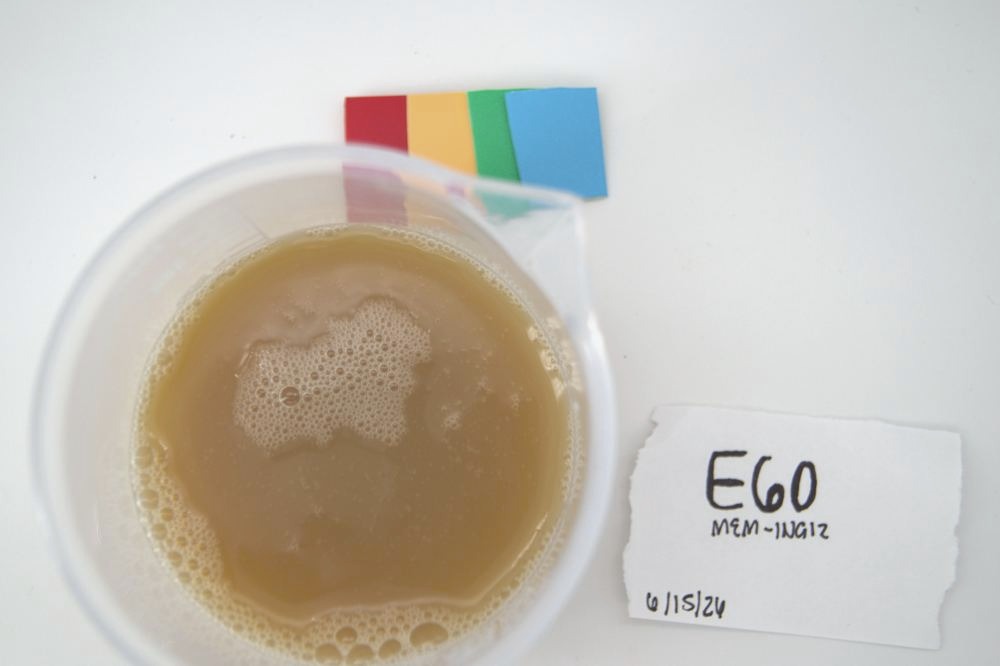
Final Extract · 2026-06-24 · color-corrected, as takenThe finished extract as it was stored and sampled for every assay in this dataset. 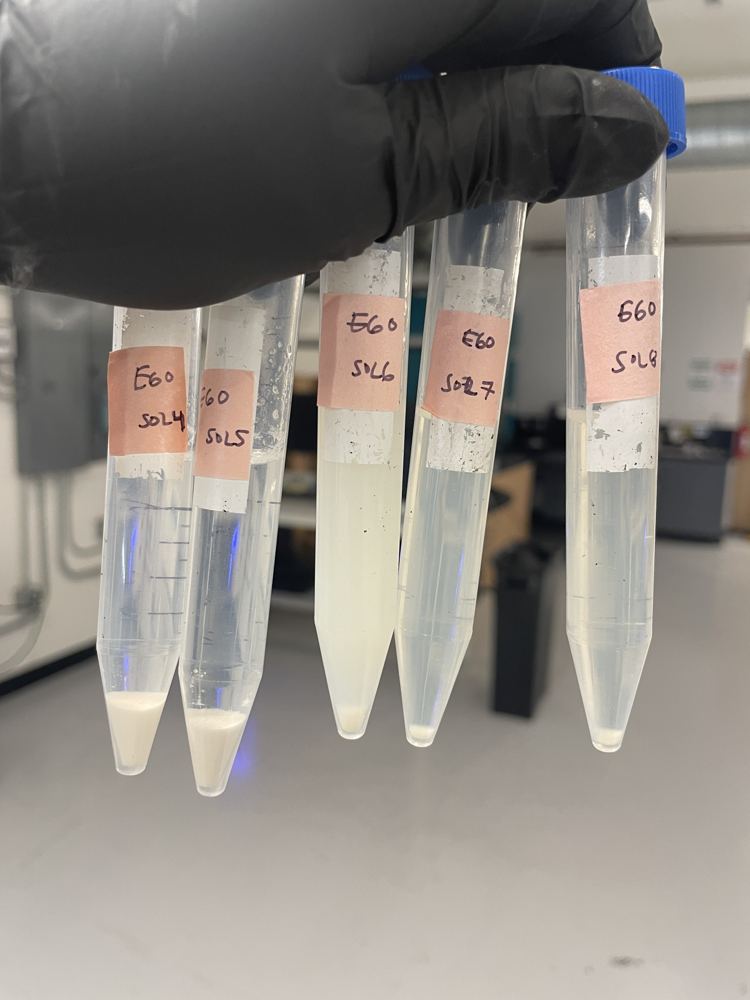
Solubility · 2026-06-17Tubes after the spin, one per pH. Solubility is the protein measured in the supernatant above the pellet (Bradford) against the dispersion before the spin, so a clear supernatant over a solid pellet reads low. 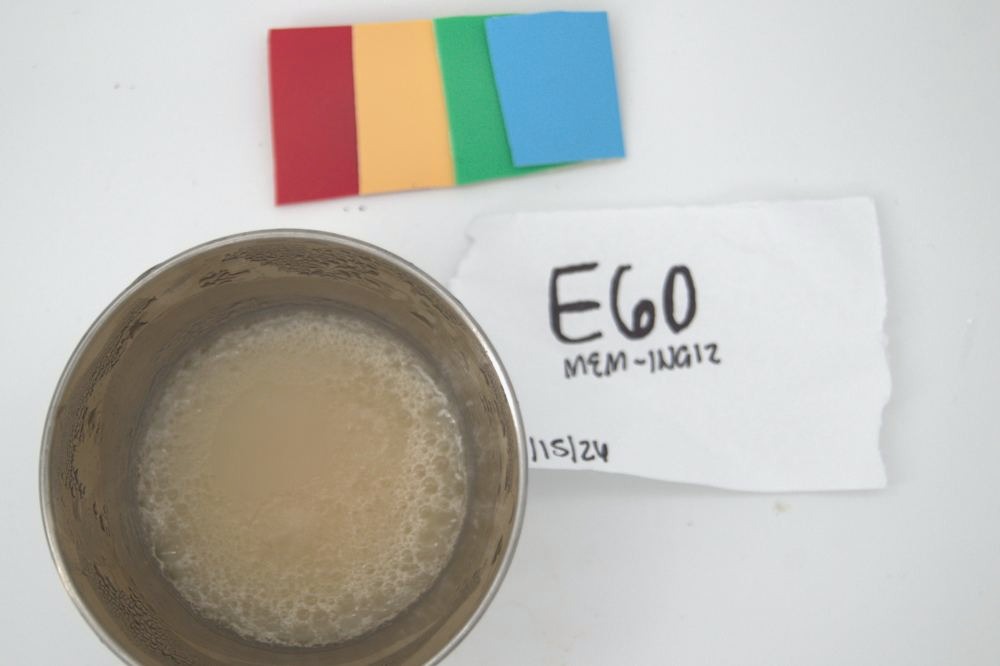
10% Gel (post-TPA) · 2026-06-24 · color-corrected, as takenThe gel after the two-compression texture test. Firmness is the force at the first compression peak.
Photos from the lab, released under the dataset's license. Where marked color-corrected, the photo is adjusted so the four colored tapes and the background look the same in every photo, whatever the light; the photo as taken is linked beside it. Click a photo for the full image.
Protein bands (SDS-PAGE)
Which proteins make up the extract, and how large are they?
Protein entries: UniProt (CC BY 4.0). Structures: biological assemblies from the RCSB Protein Data Bank (Berman et al., 2000; CC0) where the protein has one of its own, otherwise the AlphaFold Protein Structure Database (Jumper et al., 2021; Varadi et al., 2024; CC BY 4.0). Each structure links to its entry. Copied 2026-10-27.
DLS - Particle Size v5.0
How large are the particles the protein forms in water? How it is measured
IPI, isoelectric precipitationMPI, micellar isolationMEM, membrane concentration Hover a peak for its size and the run count.
IPI, isoelectric precipitationMPI, micellar isolationMEM, membrane concentration Whiskers: ×/÷ the geometric SD of the replicates (the spread on the log scale); dashed outline and small number: under the caveat of that number (listed below; click the bar to see it); bold outline: on your shortlist. Ingredients in crop order; log scale.
IPI, isoelectric precipitationMPI, micellar isolationMEM, membrane concentration Whiskers: ± SD; dashed outline and small number: under the caveat of that number (listed below; click the bar to see it); bold outline: on your shortlist. Ingredients in crop order.
Mean ± SD (n replicates).
| Metric | Unit | DG-0005-IPI | DG-0005-MPI | DG-0005-MEM |
|---|---|---|---|---|
| Particle size (hydrodynamic diameter) (0.1 M phosphate buffer pH 7, 0.05 % protein) | nm | 68.2 ± 20.2 (n=3) | 49.0 ± 6.39 (n=3) | 90.9 ± 3.62 (n=2) |
| Particle size (hydrodynamic diameter) (0.1 M phosphate buffer pH 7, 0.1 % protein) | nm | 116 ± 5.95 (n=3) | 73.5 ± 1.97 (n=3) | 104 ± 12.8 (n=2) |
| Particle size (hydrodynamic diameter) (water, 0.05 % protein) | nm | 170 ± 28.0 (n=2) | 88.1 ± 5.53 (n=2) | |
| Particle size (hydrodynamic diameter) (water, 0.1 % protein) | nm | 157 ± 8.44 (n=3) | 99.5 ± 0.783 (n=2) | |
| Polydispersity index (0.1 M phosphate buffer pH 7, 0.05 % protein) | % | 27.1 ± 1.52 (n=3) | 27.5 ± 0.372 (n=3) | 27.1 ± 0.413 (n=2) |
| Polydispersity index (0.1 M phosphate buffer pH 7, 0.1 % protein) | % | 27.4 ± 2.28 (n=3) | 27.1 ± 1.62 (n=3) | 28.0 ± 0.344 (n=2) |
| Polydispersity index (notebook entry, condition not recorded) | % | 68.3 ± 22.3 (n=4) | 27.9 (n=1) | |
| Polydispersity index (water, 0.05 % protein) | % | 21.8 ± 2.56 (n=2) | 29.3 ± 1.73 (n=2) | |
| Polydispersity index (water, 0.1 % protein) | % | 20.5 ± 0.449 (n=3) | 27.4 ± 0.534 (n=2) |
DSC - Differential Scanning Calorimetry v5.0
At what temperature does the protein denature, if at all? How it is measured
IPI, isoelectric precipitationMPI, micellar isolationMEM, membrane concentration Whiskers: ± SD; hover a point for its value.
IPI, isoelectric precipitationMPI, micellar isolationMEM, membrane concentration Whiskers: ± SD; dashed outline and small number: under the caveat of that number (listed below; click the bar to see it); bold outline: on your shortlist. Ingredients in crop order.
IPI, isoelectric precipitationMPI, micellar isolationMEM, membrane concentration Whiskers: ± SD; dashed outline and small number: under the caveat of that number (listed below; click the bar to see it); bold outline: on your shortlist. Ingredients in crop order.
IPI, isoelectric precipitationMPI, micellar isolationMEM, membrane concentration Whiskers: ± SD; dashed outline and small number: under the caveat of that number (listed below; click the bar to see it); bold outline: on your shortlist. Ingredients in crop order.
IPI, isoelectric precipitationMPI, micellar isolationMEM, membrane concentration Whiskers: ± SD; dashed outline and small number: under the caveat of that number (listed below; click the bar to see it); bold outline: on your shortlist. Ingredients in crop order.
Mean ± SD (n replicates).
| Metric | Unit | DG-0005-IPI | DG-0005-MPI | DG-0005-MEM |
|---|---|---|---|---|
| Denaturation peak temperature | °C | 94.5 ± 0.303 (n=3) | 94.5 ± 0.0451 (n=3) | 95.1 (n=1) |
| Denaturation onset temperature | °C | 88.8 ± 0.191 (n=3) | 87.2 ± 0.422 (n=3) | 90.0 (n=1) |
| Denaturation enthalpy | J/g | 1.14 ± 0.0657 (n=3) | 1.69 ± 0.0609 (n=3) | 0.519 (n=1) |
| Denaturation enthalpy per gram of protein | J/g protein | 3.92 (n=3) | 11.1 (n=3) | 4.99 (n=1) |
Emulsion Capacity (Centrifugation) v5.1
How much of an oil and water mix does the protein turn into emulsion, and does it survive heating? How it is measured
IPI, isoelectric precipitationMPI, micellar isolationMEM, membrane concentration Pale bar behind: emulsified layer before heating (measured, % of the column); solid bar: the layer after 30 min at 80 °C, derived as capacity × heat stability ÷ 100, replicate by replicate. Whiskers: ± SD; dashed outline and small number: under the caveat of that number (listed below; click the bar to see it); bold outline: on your shortlist. Ingredients in crop order.
IPI, isoelectric precipitationMPI, micellar isolationMEM, membrane concentration Whiskers: ± SD; dashed outline and small number: under the caveat of that number (listed below; click the bar to see it); bold outline: on your shortlist. Ingredients in crop order.
Mean ± SD (n replicates).
| Metric | Unit | DG-0005-IPI | DG-0005-MPI | DG-0005-MEM |
|---|---|---|---|---|
| Emulsion capacity | % of height | 45.4 ± 0.795 (n=3) | 48.6 ± 0.485 (n=3) | 44.1 ± 4.17 (n=3) |
| Emulsion heat stability | % of layer | 99.5 ± 0.947 (n=3) | 98.8 ± 1.00 (n=3) | 98.8 ± 1.01 (n=3) |
Emulsion Kinetics (Turbiscan) v5.0
How does an emulsion made with these proteins change over the course of an hour? How it is measured
IPI, isoelectric precipitationMPI, micellar isolationMEM, membrane concentration Whiskers: ± SD; hover a point for its value.
IPI, isoelectric precipitationMPI, micellar isolationMEM, membrane concentration Whiskers: ± SD; dashed outline and small number: under the caveat of that number (listed below; click the bar to see it); bold outline: on your shortlist. Ingredients in crop order.
IPI, isoelectric precipitationMPI, micellar isolationMEM, membrane concentration Whiskers: ± SD; dashed outline and small number: under the caveat of that number (listed below; click the bar to see it); bold outline: on your shortlist. Ingredients in crop order.
Mean ± SD (n replicates).
| Metric | Unit | DG-0005-IPI | DG-0005-MPI | DG-0005-MEM |
|---|---|---|---|---|
| Creaming index | % of height | 10.2 ± 3.40 (n=3) | 12.2 ± 0.566 (n=3) | 11.0 ± 0.631 (n=3) |
| Turbiscan Stability Index | 1 | 21.4 ± 2.29 (n=3) | 23.6 ± 0.833 (n=3) | 18.9 ± 0.529 (n=3) |
Foaming Capacity v5.0
How much foam does the protein make, and how much of it is left after 30 minutes? How it is measured
IPI, isoelectric precipitationMPI, micellar isolationMEM, membrane concentration Whiskers: ± SD; dashed outline and small number: under the caveat of that number (listed below; click the bar to see it); bold outline: on your shortlist. Ingredients in crop order.
IPI, isoelectric precipitationMPI, micellar isolationMEM, membrane concentration Whiskers: ± SD; dashed outline and small number: under the caveat of that number (listed below; click the bar to see it); bold outline: on your shortlist. Ingredients in crop order.
IPI, isoelectric precipitationMPI, micellar isolationMEM, membrane concentration Pale bar behind: initial height; solid bar: final height. Whiskers: ± SD; dashed outline and small number: under the caveat of that number (listed below; click the bar to see it); bold outline: on your shortlist. Ingredients in crop order.
IPI, isoelectric precipitationMPI, micellar isolationMEM, membrane concentration Crosses: ± SD of each measure; dashed ring: under a caveat; bold outline: on your shortlist.
Mean ± SD (n replicates).
| Metric | Unit | DG-0005-IPI | DG-0005-MPI | DG-0005-MEM |
|---|---|---|---|---|
| Foam capacity | % of liquid height | 181 ± 6.09 (n=3) | 162 ± 7.97 (n=3) | 198 ± 2.61 (n=3) |
| Foam height, final | mm | 15.4 ± 0.312 (n=3) | 12.6 ± 0.997 (n=3) | 19.1 ± 1.09 (n=3) |
| Foam height, initial | mm | 24.4 ± 2.84 (n=3) | 17.8 ± 1.73 (n=3) | 25.3 ± 1.18 (n=3) |
| Foam stability | % of initial foam | 63.6 ± 6.32 (n=3) | 70.9 ± 5.31 (n=3) | 75.6 ± 6.78 (n=3) |
Gel Strength v5.0
How firm and springy a gel does the protein form when heated? How it is measured
IPI, isoelectric precipitationMEM, membrane concentration Whiskers: ± SD; hover a point for its value.
IPI, isoelectric precipitationMEM, membrane concentration Whiskers: ± SD; dashed outline and small number: under the caveat of that number (listed below; click the bar to see it); bold outline: on your shortlist. Ingredients in crop order.
IPI, isoelectric precipitationMEM, membrane concentration Whiskers: ± SD; dashed outline and small number: under the caveat of that number (listed below; click the bar to see it); bold outline: on your shortlist. Ingredients in crop order.
IPI, isoelectric precipitationMEM, membrane concentration Whiskers: ± SD; dashed outline and small number: under the caveat of that number (listed below; click the bar to see it); bold outline: on your shortlist. Ingredients in crop order.
Mean ± SD (n replicates).
| Metric | Unit | DG-0005-IPI | DG-0005-MPI | DG-0005-MEM |
|---|---|---|---|---|
| Gel cohesiveness | 1 | 0.909 ± 0.0167 (n=6)1 | 0.804 ± 0.0983 (n=5)1 | |
| Gel hardness | g | 12.2 ± 0.581 (n=6)1 | 9.70 ± 0.557 (n=5)1 | |
| Gel springiness | 1 | 0.771 ± 0.0456 (n=6)1 | 0.477 ± 0.155 (n=5)1 |
- The gels were heated at about 80 °C instead of the method's 90 °C: the water bath cooled after the samples went in. These proteins unfold at about 94 °C, so gel firmness is likely understated, and the micellar extract did not form a gel.Applies to DG-0005-IPI, DG-0005-MEM: Gel cohesiveness, Gel hardness, Gel springiness.
LECO - Protein Content v3.0
How much protein is in the extract? How it is measured
IPI, isoelectric precipitationMPI, micellar isolationMEM, membrane concentration Whiskers: ± SD; dashed outline and small number: under the caveat of that number (listed below; click the bar to see it); bold outline: on your shortlist. Ingredients in crop order.
IPI, isoelectric precipitationMPI, micellar isolationMEM, membrane concentration Whiskers: ± SD; dashed outline and small number: under the caveat of that number (listed below; click the bar to see it); bold outline: on your shortlist. Ingredients in crop order.
IPI, isoelectric precipitationMPI, micellar isolationMEM, membrane concentration Whiskers: ± SD; dashed outline and small number: under the caveat of that number (listed below; click the bar to see it); bold outline: on your shortlist. Ingredients in crop order.
IPI, isoelectric precipitationMPI, micellar isolationMEM, membrane concentration Whiskers: ± SD; dashed outline and small number: under the caveat of that number (listed below; click the bar to see it); bold outline: on your shortlist. Ingredients in crop order.
Mean ± SD (n replicates).
| Metric | Unit | DG-0005-IPI | DG-0005-MPI | DG-0005-MEM |
|---|---|---|---|---|
| Nitrogen-to-protein factor | 1 | 5.50 (n=1) | 5.50 (n=1) | 5.50 ± 0 (n=2) |
| Nitrogen | % w/w | 5.28 (n=1) | 2.77 (n=1) | 1.89 ± 0.113 (n=2) |
| Protein, as is | % w/w | 29.0 (n=1) | 15.2 (n=1) | 10.4 ± 0.622 (n=2) |
| Protein, dry basis | % w/w dry basis | 74.5 (n=1) | 86.7 (n=1) | 65.7 ± 3.94 (n=2) |
Moisture/Ash Content v1.0
How much water and mineral (ash) does it carry? How it is measured
IPI, isoelectric precipitationMPI, micellar isolationMEM, membrane concentration Whiskers: ± SD; dashed outline and small number: under the caveat of that number (listed below; click the bar to see it); bold outline: on your shortlist. Ingredients in crop order.
IPI, isoelectric precipitationMPI, micellar isolationMEM, membrane concentration Whiskers: ± SD; dashed outline and small number: under the caveat of that number (listed below; click the bar to see it); bold outline: on your shortlist. Ingredients in crop order.
Mean ± SD (n replicates).
| Metric | Unit | DG-0005-IPI | DG-0005-MPI | DG-0005-MEM |
|---|---|---|---|---|
| Ash, dry basis | % w/w dry basis | 0.433 ± 0.0551 (n=3) | 0.670 ± 0.529 (n=3) | 6.77 ± 0.108 (n=3) |
| Moisture | % w/w | 61.0 ± 0.776 (n=3) | 82.4 ± 0.0755 (n=3) | 84.2 ± 0.0404 (n=3) |
Solubility (Bradford) v5.0
How much of the protein dissolves, and at which pH? How it is measured
IPI, isoelectric precipitationMPI, micellar isolationMEM, membrane concentration Whiskers: ± SD; hover a point for its value.
IPI, isoelectric precipitationMPI, micellar isolationMEM, membrane concentration Whiskers: ± SD; hover a point for its value.
IPI, isoelectric precipitationMPI, micellar isolationMEM, membrane concentration Whiskers: ± SD; hover a point for its value.
Readings above 100 % (the assay scatters near full solubility) are shown as 100 %; the downloadable files keep the values as measured.
Mean ± SD (n replicates).
| Metric | Unit | DG-0005-IPI | DG-0005-MPI | DG-0005-MEM |
|---|---|---|---|---|
| Protein in the supernatant, after centrifugation, pH 4 | mg/mL | 0.0919 (n=1) | 4.28 (n=1) | 0.182 (n=1) |
| Protein in the supernatant, after centrifugation, pH 5 | mg/mL | 0.0641 (n=1) | 0.0525 (n=1) | 0.148 (n=1) |
| Protein in the supernatant, after centrifugation, pH 6 | mg/mL | 1.06 (n=1) | 0.0852 (n=1) | 5.38 (n=1) |
| Protein in the supernatant, after centrifugation, pH 7 | mg/mL | 6.51 (n=1) | 6.39 (n=1) | 5.77 (n=1) |
| Protein in the supernatant, after centrifugation, pH 8 | mg/mL | 7.50 (n=1) | 6.31 (n=1) | 5.90 (n=1) |
| Protein in the dispersion, before centrifugation, pH 4 | mg/mL | 7.89 (n=1) | 6.65 (n=1) | 8.65 (n=1) |
| Protein in the dispersion, before centrifugation, pH 5 | mg/mL | 10.1 (n=1) | 6.92 (n=1) | 8.29 (n=1) |
| Protein in the dispersion, before centrifugation, pH 6 | mg/mL | 5.90 (n=1) | 6.84 (n=1) | 6.80 (n=1) |
| Protein in the dispersion, before centrifugation, pH 7 | mg/mL | 7.15 (n=1) | 6.92 (n=1) | 7.01 (n=1) |
| Protein in the dispersion, before centrifugation, pH 8 | mg/mL | 9.14 (n=1) | 7.57 (n=1) | 7.18 (n=1) |
| Solubility, pH 4 | % of protein | 1.16 (n=1) | 64.3 (n=1) | 2.12 (n=1) |
| Solubility, pH 5 | % of protein | 0.640 (n=1) | 0.760 (n=1) | 1.79 (n=1) |
| Solubility, pH 6 | % of protein | 18.0 (n=1) | 1.25 (n=1) | 79.2 (n=1) |
| Solubility, pH 7 | % of protein | 91.2 (n=1) | 92.4 (n=1) | 82.4 (n=1) |
| Solubility, pH 8 | % of protein | 82.0 (n=1) | 83.4 (n=1) | 82.2 (n=1) |
Not measured
| Extract | Assay | Reason |
|---|---|---|
| DG-0005-MPI | GEL | No gel formed: the dispersions were heated at about 80 °C, short of the method's 90 °C, and did not set, so there was nothing to measure. |
Every replicate is in the data API and in values.csv. Cite the release as Jones, V. P., Moore, I. V., & Westcott, D. (2026). Data Garden plant protein dataset (Version 2026.1) [Data set]. https://doi.org/10.5281/zenodo.23548545